Sunday, 25 January 2026

Northern Ireland’s Green Economy Performance: A Data-Driven Analysis

Aerial view of Northern Ireland's diverse landscape featuring agricultural land, wind farms, and coastline representing the region's environmental challenges and opportunities

Environmental data for Northern Ireland shows both progress and challenges in the region’s green transition. This definitive collection of environmental data from Northern Ireland provides sustainability professionals with crucial metrics on emissions, renewable energy adoption, waste management performance and biodiversity statistics across all eleven council areas. Northern Ireland’s sustainability landscape presents unique opportunities and challenges […]

Environmental data for Northern Ireland shows both progress and challenges in the region’s green transition. This definitive collection of environmental data from Northern Ireland provides sustainability professionals with crucial metrics on emissions, renewable energy adoption, waste management performance and biodiversity statistics across all eleven council areas.

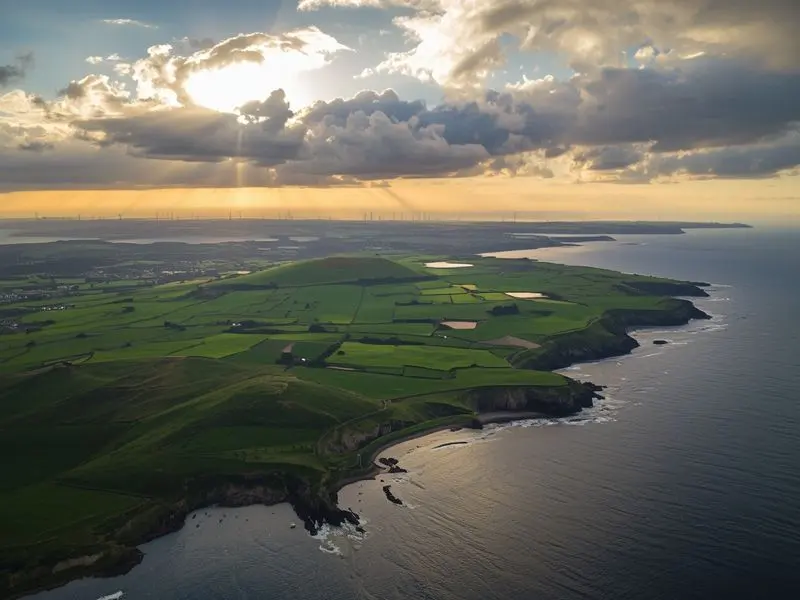
Northern Ireland’s sustainability landscape presents unique opportunities and challenges within the UK and all-island context. With a population of 1.9 million and over 75,000 businesses, the region balances industrial heritage with ambitious environmental targets. This comprehensive analysis of environmental data Northern Ireland provides essential metrics for sustainability professionals, business leaders, and policy makers navigating the region’s green transition.

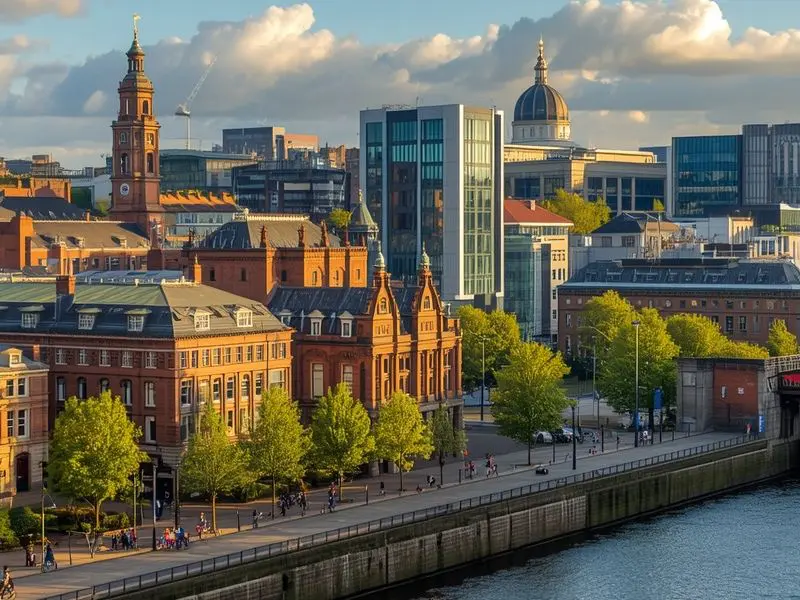
The All-Ireland Sustainability Network brings together organisations from Belfast to Derry, from manufacturing giants to innovative SMEs, all working toward shared environmental goals. These statistics reflect the collective progress and remaining challenges our 600+ members address daily.

Emissions Profile: Northern Ireland’s Carbon Challenge

Northern Ireland dairy farm showcasing the agricultural sector that represents 27.8% of the region's greenhouse gas emissions

Greenhouse Gas Emissions Breakdown

Environmental data Northern Ireland reveals total emissions of 20.9 million tonnes CO2 equivalent, representing approximately 4.5% of total UK emissions. The sectoral distribution reveals distinct regional characteristics:

Emissions by Sector (2024):

  • Agriculture: 27.8% (5.8 MtCO2e)
  • Transport: 22.4% (4.7 MtCO2e)
  • Residential: 18.6% (3.9 MtCO2e)
  • Energy Supply: 13.2% (2.8 MtCO2e)
  • Business: 11.9% (2.5 MtCO2e)
  • Industrial Processes: 4.3% (0.9 MtCO2e)
  • Waste Management: 1.8% (0.3 MtCO2e)

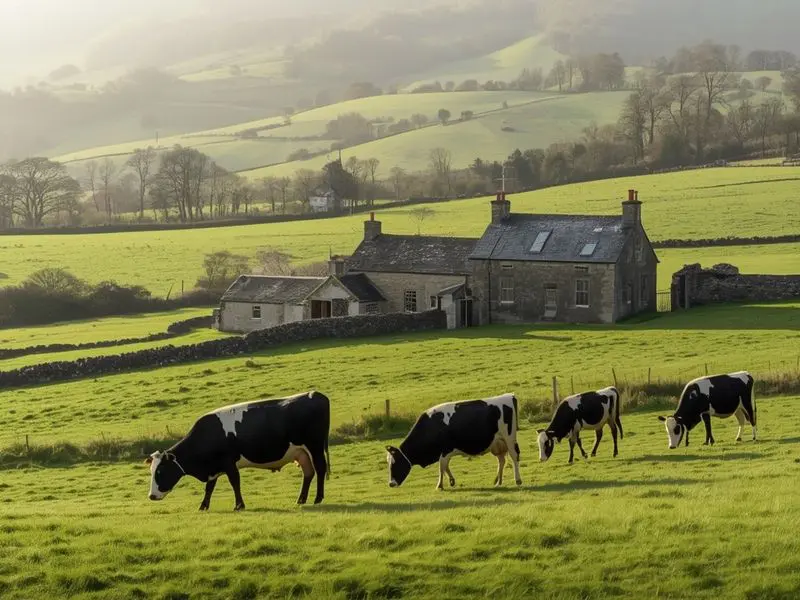
Agriculture’s prominence – compared to 10% UK average – shapes Northern Ireland’s unique decarbonisation pathway. Our member organisations across the agri-food sector are pioneering solutions shared through All-Ireland Sustainability’s knowledge exchange programmes.

Progress Against Targets

Northern Ireland’s emissions have decreased 23% since 1990 baseline:

  • Energy sector: -58% (coal phase-out impact)
  • Waste: -62% (methane capture improvements)
  • Industrial: -31% (efficiency gains)
  • Transport: +18% (increased vehicle usage)
  • Agriculture: -12% (productivity improvements)

The Climate Change Act (Northern Ireland) 2022 mandates:

  • 48% reduction by 2030
  • 82% reduction by 2040
  • Net zero by 2050

Current trajectory achieves only 35% reduction by 2030, highlighting the acceleration needed across all sectors.

Business Sustainability Adoption: Regional Statistics

Corporate Environmental Action

Research across Northern Ireland businesses reveals varying sustainability maturity:

Large Businesses (250+ employees):

  • 71% have environmental management systems
  • 63% publicly report sustainability metrics
  • 48% have net-zero commitments
  • 82% increased sustainability budgets in 2024

SMEs (10-249 employees):

  • 31% measure environmental impact
  • 24% have formal sustainability policies
  • 18% dedicated sustainability resources
  • 64% plan sustainability investments by 2026

Micro Businesses (<10 employees):

  • 12% track environmental metrics
  • 8% have written environmental policies
  • 45% interested in sustainability support
  • 71% cite cost as primary barrier

This implementation gap drives membership growth in our SME and Individual tiers, providing accessible expertise and peer support for smaller organisations.

Investment Patterns

Northern Ireland sustainability investments totalled £487 million in 2024:

  • Renewable energy installations: £178 million
  • Energy efficiency retrofits: £142 million
  • Waste reduction systems: £67 million
  • Sustainable transport: £54 million
  • Natural capital projects: £46 million

Return on investment data from our network members shows:

  • Average payback period: 4.2 years
  • Energy cost savings: 18-35%
  • Waste cost reduction: 22% average
  • Enhanced brand value: 67% report improved reputation

Renewable Energy: Generation and Consumption

Onshore wind turbines generating renewable electricity in Northern Ireland, part of the 26.8% wind power contribution to the regional grid

Electricity Generation Mix

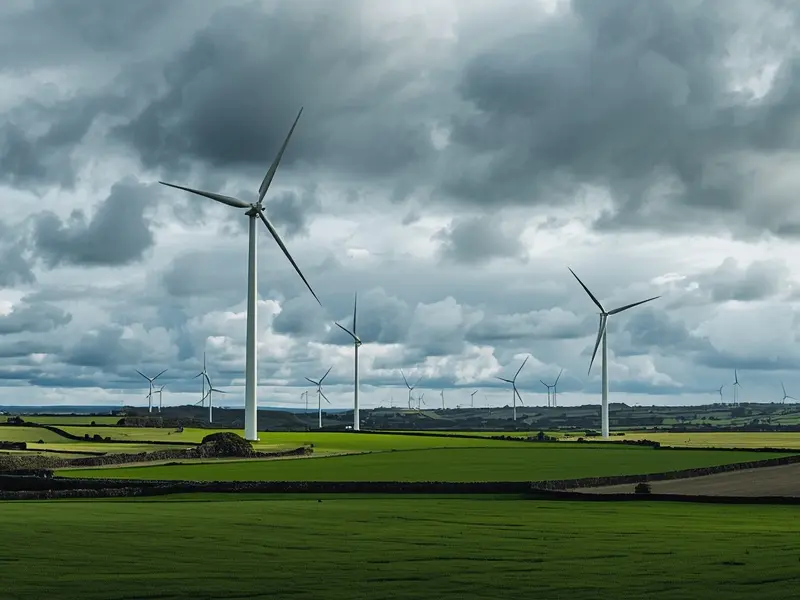
Northern Ireland’s electricity generation shows rapid renewable growth:

Current Generation Sources:

  • Natural Gas: 47.2%
  • Wind (Onshore): 26.8%
  • Imports (via interconnectors): 13.4%
  • Coal: 5.1%
  • Solar PV: 3.2%
  • Other Renewables: 4.3%

Total renewable electricity: 34.3% (2024) Target: 80% by 2030

Installed Capacity:

  • Onshore wind: 1,625 MW
  • Solar PV: 285 MW
  • Anaerobic digestion: 42 MW
  • Hydro: 8 MW

Renewable Energy Potential

Untapped renewable resources present significant opportunities:

  • Offshore wind potential: 25 GW (currently 0 MW)
  • Rooftop solar potential: 2.8 GW (10% utilised)
  • Geothermal resource: 150 MW thermal equivalent
  • Tidal energy: 200 MW potential

These opportunities feature prominently in our Summit discussions, connecting developers with corporate energy buyers through our Leadership Circle network.

Circular Economy: Waste and Resource Statistics

Waste Management Performance

Northern Ireland generates 5.1 million tonnes of waste annually:

Waste by Source:

  • Household: 985,000 tonnes
  • Commercial & Industrial: 1,764,000 tonnes
  • Construction & Demolition: 2,351,000 tonnes

Treatment Methods:

  • Recycling: 50.1%
  • Recovery (energy/other): 23.4%
  • Landfill: 22.8%
  • Composting: 3.7%

Landfill rate remains above UK average (8.5%), representing both challenge and opportunity for circular economy innovation.

Recycling and Recovery Rates

Material-specific recycling performance:

  • Paper/Cardboard: 68%
  • Glass: 71%
  • Metals: 64%
  • Plastics: 32%
  • Organics: 42%
  • Textiles: 18%
  • WEEE: 54%

Northern Ireland’s overall recycling rate of 50.1% exceeds UK average (44.1%) but falls short of leading European regions (>65%). Our member organisations showcase best practices achieving 70%+ diversion rates through innovative approaches shared at networking events.

Water Resources: Quality and Management

Clean river waterway in Northern Ireland, representing the region's monitored water bodies where 31.2% achieve good or high ecological status

Water Body Status

Environmental data Northern Ireland water statistics show:

  • 450 river water bodies monitored
  • 21 lake water bodies assessed
  • 35 transitional and coastal water bodies

Ecological Status:

  • Good or High: 31.2%
  • Moderate: 38.4%
  • Poor: 24.1%
  • Bad: 6.3%

Agricultural runoff impacts 68% of failing water bodies, driving collaboration between environmental groups and farming organisations within our network.

Water Consumption and Efficiency

Business water usage patterns:

  • Total non-domestic consumption: 145 million m³/year
  • Manufacturing: 42%
  • Agriculture: 28%
  • Services: 19%
  • Public sector: 11%

Water efficiency improvements since 2020:

  • 18% reduction in manufacturing water intensity
  • 24% decrease in hospitality consumption
  • 31% reduction in public building usage

Members report average 26% water cost savings through efficiency measures shared in our resource library.

Biodiversity: Natural Capital Metrics

Protected peatland habitat in Northern Ireland, part of 242,000 hectares of peatlands with only 12% in good condition

Protected Areas and Habitats

Northern Ireland’s biodiversity statistics:

  • Special Areas of Conservation: 57 sites (88,000 hectares)
  • Special Protection Areas: 16 sites (115,000 hectares)
  • Areas of Special Scientific Interest: 394 sites (108,000 hectares)
  • National Nature Reserves: 47 sites (5,200 hectares)

Total protected area: 11.4% of land surface

Priority Habitats:

  • Peatlands: 242,000 hectares (12% in good condition)
  • Native woodland: 48,000 hectares (2% of land area)
  • Species-rich grassland: 15,000 hectares (declining 3% annually)
  • Wetlands: 35,000 hectares (40% degraded)

Corporate Biodiversity Action

Business engagement with nature:

  • 127 companies signed biodiversity pledges
  • £28 million invested in habitat restoration (2024)
  • 3,400 hectares under corporate management
  • 230 biodiversity action plans implemented

Our Biodiversity Initiative Award winners demonstrate measurable improvements, from pollinator gardens to peatland restoration, inspiring replication across the network.

Green Jobs: Employment and Skills Data

Belfast city center representing Northern Ireland's urban sustainability efforts with commercial buildings requiring energy efficiency improvements

Environmental Sector Employment

Northern Ireland’s green economy employs approximately 32,400 people:

Sector Distribution:

  • Renewable energy: 8,200 jobs
  • Environmental services: 6,900 jobs
  • Energy efficiency: 5,400 jobs
  • Waste management: 4,800 jobs
  • Sustainable agriculture: 3,600 jobs
  • Environmental consulting: 2,100 jobs
  • Green finance: 1,400 jobs

Growth rate: 7.8% annually (2020-2024) Projected jobs by 2030: 56,000

Skills Demand Analysis

Critical skills gaps identified:

  • Retrofit coordinators: 850 positions needed
  • Heat pump engineers: 1,200 shortage
  • ESG specialists: 600 vacancies
  • Solar installers: 450 required
  • Carbon assessors: 380 gaps

Average salary premiums for green skills: 12-28% above traditional roles

This skills shortage drives participation in our professional development programmes, with members accessing exclusive training and networking opportunities.

Transport: Decarbonisation Progress

Electric vehicle charging at one of Northern Ireland's 1,847 public charge points supporting transport decarbonization

Vehicle Statistics

Northern Ireland’s transport transformation:

Current Vehicle Fleet:

  • Total vehicles: 1,261,000
  • Electric vehicles: 14,200 (1.1%)
  • Plug-in hybrids: 8,400 (0.7%)
  • Hybrid vehicles: 31,600 (2.5%)
  • Diesel: 456,000 (36.2%)
  • Petrol: 751,000 (59.5%)

EV Infrastructure:

  • Public charge points: 1,847
  • Rapid chargers: 342
  • Population per charge point: 1,028
  • Target by 2030: 10,000 charge points

Modal Share and Emissions

Transport mode distribution:

  • Private car: 71% of journeys
  • Walking: 17%
  • Public transport: 7%
  • Cycling: 2%
  • Other: 3%

Transport emissions intensity:

  • Average car emissions: 168g CO2/km
  • Bus emissions per passenger km: 82g
  • Rail emissions per passenger km: 41g
  • Active travel: 0g

Members in our Transport Working Group share strategies reducing fleet emissions by average 32% through electrification and route optimisation.

Buildings: Energy Performance Data

Commercial Building Performance

Energy Performance Certificate distribution:

  • A-rated: 2.8%
  • B-rated: 14.3%
  • C-rated: 31.2%
  • D-rated: 28.4%
  • E-rated: 16.7%
  • F-rated: 5.2%
  • G-rated: 1.4%

Average commercial building energy consumption: 215 kWh/m²/year Best practice (our member achievements): <100 kWh/m²/year

Residential Sector Statistics

Housing stock energy performance:

  • Total dwellings: 820,000
  • Average EPC rating: D (SAP 59)
  • Cavity wall insulation: 68%
  • Loft insulation (>100mm): 84%
  • Double glazing: 89%
  • Heat pumps installed: 3,400 (0.4%)

Fuel poverty affects 22% of households, driving social sustainability initiatives among our charity and public sector members.

Manufacturing: Industrial Sustainability Metrics

Sector Performance

Manufacturing represents 16.1% of Northern Ireland’s economy:

  • Annual output: £21.8 billion
  • Direct employment: 85,000
  • Energy consumption: 28% of total
  • Emissions: 2.5 MtCO2e (11.9% of total)

Sustainability Adoption:

  • ISO 14001 certified: 34% of manufacturers
  • Energy management systems: 41%
  • Circular economy practices: 29%
  • Renewable energy use: 23%

Resource Efficiency Gains

Manufacturing improvements since 2020:

  • Energy intensity: -19%
  • Water consumption: -24%
  • Waste generation: -31%
  • Material productivity: +16%

Leading manufacturers in our network achieve 40-50% better resource efficiency than sector averages through best practice sharing.

Policy Landscape: Regulatory Statistics

Northern Ireland's protected coastal waters, part of 35 transitional and coastal water bodies monitored for ecological status

Environmental Compliance

Regulatory enforcement data:

  • Environmental permits issued: 3,847
  • Compliance rate: 87%
  • Enforcement notices: 342 (2024)
  • Prosecutions: 28
  • Total penalties: £2.4 million

Upcoming Regulations Impact:

  • Businesses affected by CSRD: 450
  • Extended Producer Responsibility: 12,000 companies
  • Biodiversity net gain: 2,800 developments annually
  • Energy efficiency standards: 35,000 buildings

Our members receive early insight and preparation support through exclusive policy briefings and compliance workshops.

Environmental Data Northern Ireland: Regional Variations by Council Area

Sustainability Leadership by Council

Performance across 11 council areas varies significantly:

Top Performers (emissions reduction since 2015):

  1. Lisburn & Castlereagh: -31%
  2. Ards & North Down: -28%
  3. Belfast City: -26%
  4. Antrim & Newtownabbey: -24%
  5. Newry, Mourne & Down: -23%

Renewable Energy Leaders (% renewable electricity):

  1. Fermanagh & Omagh: 61%
  2. Causeway Coast & Glens: 54%
  3. Mid Ulster: 48%
  4. Derry & Strabane: 41%
  5. Mid & East Antrim: 38%

All 11 councils participate in All-Ireland Sustainability initiatives, sharing strategies through our public sector forum.

Investment and Finance: Green Capital Flows

Sustainable Finance Statistics

Green finance activity in Northern Ireland:

  • Green loans issued: £342 million (2024)
  • Energy efficiency grants: £67 million
  • Renewable energy investment: £178 million
  • Natural capital funding: £23 million
  • R&D for clean tech: £41 million

Funding Sources:

  • Private sector: 54%
  • Government grants: 28%
  • EU funds: 12%
  • Philanthropic: 6%

Access to finance remains the second-highest barrier for SMEs (after skills), addressed through our member funding workshops and investor connections.

Future Outlook: 2030 Projections

Trajectory Analysis

Based on current environmental data Northern Ireland policies and commitments:

Likely to Achieve:

  • 50% waste recycling (target: 65%)
  • 60% renewable electricity (target: 80%)
  • 35,000 green jobs (target: 40,000)

Significant Gaps:

  • 35% emissions reduction (target: 48%)
  • 45,000 EVs (target: 200,000)
  • 15% energy efficiency improvement (target: 35%)

These gaps represent opportunities for innovation and collaboration – exactly what All-Ireland Sustainability membership facilitates.

Transform Data into Action

Sustainability professionals collaborating on Northern Ireland's green transition, representing the All-Ireland Sustainability Network's 600+ member organizations

Northern Ireland’s sustainability data reveals clear patterns: progress is accelerating but remains insufficient for 2030 targets. The organisations closing these gaps – our members – succeed through collaboration, knowledge sharing, and collective ambition.

Whether you’re benchmarking performance, seeking partnerships, or building your sustainability strategy, these statistics provide the foundation. But data alone doesn’t drive change – connection with those already succeeding does.

Join 600+ organisations using data to drive Northern Ireland’s green transition

Our next member webinar, “Northern Ireland Sustainability Metrics: From Data to Delivery”, provides sector-specific analysis and practical applications. Members attend free; non-members pay €95.


Environmental Data Northern Ireland: Sources and Methodology

Data compiled from DAERA, Northern Ireland Statistics and Research Agency (NISRA), Utility Regulator NI, Invest NI, and All-Ireland Sustainability Network member reports. Updated November 2025.

Related Member Resources:

  • Download Northern Ireland sustainability dashboard
  • Access council-specific data profiles
  • View quarterly trend analysis
  • Join our Data & Metrics Working Group

Become part of Northern Ireland’s sustainability data network

Join our newsletter to get notifications on events and best practices

Name(Required)

Copyright © 2026. All Ireland Sustainability
Webdesign & Development Northern Ireland 2b:creative

Get in Touch

Name(Required)
Please select the service/s you require...(Required)
Individual
£ 120
/ Yearly
Gain exclusive insights, tools, and connections to further your personal sustainability journey and influence.
Get Started
SMEs
£ 120
/ Yearly
Access specialised support, resources, and grants to help your small or medium-sized enterprise thrive sustainably.
Get Started
Charity
£ 250
/ Yearly
Benefit from reduced rates and resources aimed at empowering non-profits to enhance their sustainability efforts.
Get Started
Gold
£ 1,200
/ Yearly
Unlock premium benefits, including advanced training, priority access to events, and recognition within our community.
Get Started

Buy Credits

Step 1 of 3 - Select Credits

Credits(Required)
Please select how many credits you would like to buy

Step 1 of 8 - Award Category

This field is for validation purposes and should be left unchanged.

Award Category

Please select an award category